B2B Leading Indicators You Need to Measure in “The New Norm”
Leading Indicators are More Important than Ever
We are living through one of the most chaotic and unpredictable times in our country’s history. This chaos forces us to be faster and better as business leaders and companies to adapt to the environment and adjust our marketing strategy and business plans. You might be desperately looking for help on marketing your ecommerce brand during a global pandemic. Or you might be looking into reevaluating your sales techniques. To make it through the turmoil and also take advantage of the amazing business opportunities that are starting to present themselves, it is critical to not only have strong accounting functions but to be looking through forward in addition to the accounting rear view mirror…
How do you do that? What do we mean? What are some examples? We will explore this in detail but it’s really about having B2B leading indicators that will predict the future. As a result, you have the data to optimize your marketing strategy and business plan before it is too late to take action.
At Power Digital, we have been able to weather the storm and continue growing our business and customer relationships even with these crazy challenges. We have done it by getting even more focused than ever on the leading indicators that drive our company’s performance.
Below is a laundry list of what we use in B2B marketing and what we have seen other leading B2B organizations leverage to drive predictable revenue growth and data driven strategic pivots across their organizations.
For Power Digital all of these micro leading indicators lead up to our “4 pillars” that drive the economic engine for our company and our forward thinking forecast model. Those 4 pillars are also leading indicators that predict our financial performance before it even happens and currently is within a 5%+/- accuracy as to where we actually end up.
Power Digital’s 4 Pillars Leading Indicators:
- New Business (President is Accountable) = Sales and Acquiring New Customers
- Client Retention (COO is Accountable) = Doing great work for our clients and keeping them
- Service Expansion (President is Accountable) = expanding upon the services we are offering our current customers as we prove ourselves and build trust
- Cost Model (CFO is Accountable) = the key pillars that assure that as we grow we are investing at the right level to grow our team, improve our product and technology while also maintaining our target profit margins.
For each of these 4 pillars we have a monthly, quarterly and annual plan and it makes our rear view mirror financial performance very predictable as we close the books each month.
Things to think about before we get deeper into Leading Indicators that Drive these 4 Pillars…
- Do you have these types of key pillars currently established in your company?
- Can you track them in real time through a dashboard?
- Can you tell what is causing you to miss or overachieve them?
- Is your model fluid so you can update pacing and see the impact in real time such as through customer engagement metrics?
- Do you have clear owners and accountability for each of them?
- Do you have leading indicators and micro-metrics that help you hit your goals for the pillars?
If the answer is not clear on any of these, we have a bit of a checklist you can use to start to build them out. The list below is a robust list of very important leading indicators for the future as we need to be even more data driven and bigger snipers to win through this crazy business environment.
Revenue Leading Indicators
Sales Activities
Measuring and reporting your sales activities (daily or weekly) is a must. Whatever the critical tactical actions your sales rep is doing is what needs to be tracked. These activities (i.e. new prospecting calls/emails, product demonstrations, proposal presentations, etc.) need to be measured and reported to ensure you see growth in your pipeline. When these activities are measured, it gives you the ability to coach to specific skill set gaps when the activities are not meeting the standards. Your sales leader should also serve as a key individual when it comes to reporting on the sales process. A sales leadershould act as the overhead and make sure the rest of the sales team has their ducks in a row and is reporting on time.
Total Pipeline Revenue
Evaluating your total sales pipeline on a regular (daily or weekly basis) is a must within the oversall sales cycle. It directly correlates to your expected (forecasted) results of the time period that your business model dictates. For example, if your business plan calls for $1M in total sales in Q4, your total pipeline target is dictated by your sales velocity (total time it takes to close a deal) and your win ratio (% of time you win a deal). Understanding that forecasting sales is a math equation, you can accurately predict with a high level of certainty what your sales will be in any given window.
New Pipeline Added (Monthly)
Following the same guidelines as the total pipeline, new business deals land in only 2 places, “close won” or “close lost”. Either way, your pipeline gets impacted and will decrease when either result happens. As such, having a new business pipeline growth target monthly to offset the decline in total pipeline is critical to consistent and predictable sales performance. Setting this KPI as a key leading indicator will help you avoid getting into trouble from a sales perspective and also help you identify when it’s time to scale and add another sales rep to your team or adjust your prospecting strategies and marketing efforts to meet the necessary demand for your growth targets.
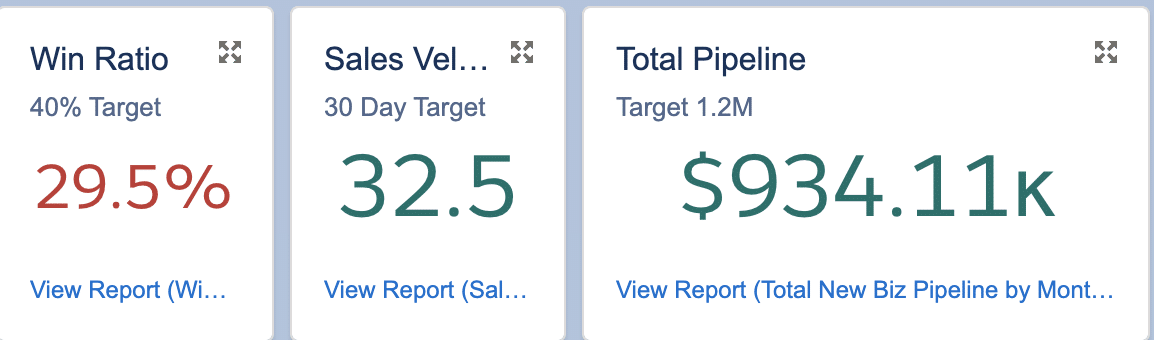
Sales Velocity & Win Ratio
These two metrics are very important leading indicators at all times but especially when the economic environment is in such a state of flux. In general, during these times companies are very cautious around new investments and often create a more robust decision making process that creates more checks and balances. Monitoring the sales cycle length against your benchmarks and win ratio will help you determine which of your sales people need more coaching and support to navigate the new decision making process and also help you pinpoint which verticals are still making buying decisions and which are maybe on more of a hold and should no longer be the focus of your prospecting efforts.
Sales Productivity by Contributor
Making your sales target is only part of the equation. How you make the target is equally as important. Why is that? If you are not sure how you are making (or missing) your sales target, you cannot scale a sales organization.
The key here is to stack rank your sales people and measure their individual productivity. How many reps are making or exceeding their quota? How many are missing? How many are missing by more than 30%? How would it impact your sales targets if you could get 50% of the reps currently missing their quota to achieve their budget goals? Do the math – sales productivity is a big reason why organizations make (or miss) their business plan targets.
To effectively scale, you’ll need a solid playbook that enables your salespeople to be productive and make their individual quotas. Oftentimes, organizations do not provide enough sales enablement for their sales people to be successful. It’s a common issue, setting expectations, coaching your sales people on your unique selling propositions and value, and then unleashing them into the wild to go win business.
While this will produce results, it’s a crazy competitive world out there. Investing in sales enablement marketing practices will greatly increase your reps’ productivity in the field – and increase their chances of winning.
Need Help with Sales Enablement? Here are 5 Tips for Crafting a Strong Sales Enablement Strategy
Sales Contribution Percentage
How much is your sales team contributing to overall profit for your company? It’s a simple equation.
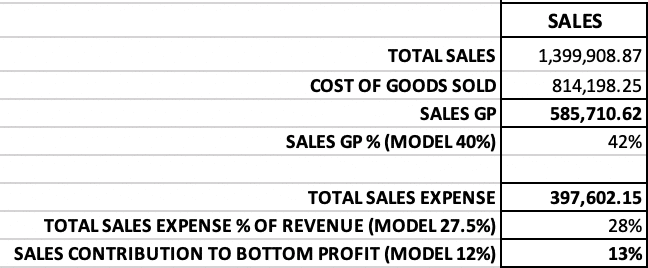
First: calculate your Sales GP (Total Sales – Cost of Goods). Model that Gross Profit % to your business projections.
Second: how much are you spending to drive those sales numbers. These expenses could include, sales reps salary, commissions, sales enablement marketing, etc. Note, you do not want to put any burden in this number, this should fall into admin expense. Once you have your total sales expense, what % does that represent of your total sales? If your Sales GP % is similar or close to your Sales Expense %, then you are not making much money with your sales team. A common question that comes up is, how does lifetime value come into play in this calculation. The short answer is – it should not. Why? Because you have other expenses related to keeping that client once they become a client that you measure separately. In direct to consumer or digital marketing, this is similar to your Client Acquisition Costs (CAC).
However, in a B2B world, you need to model out making money on the initial sale if you want to drive long-term profitability.
Revenue Trends by Vertical – To Assure You Are Focused on Winning Categories
Keep a close eye on industries that are thriving. You want to make sure that the industries that are thriving are the same ones your sales team is getting their fair share of the opportunity that is out there in the marketplace.
As you track the revenue by vertical that is being booked start to look for trends that are showing great success and lean into those trends. Additionally take best practices from those industries and apply them to other industries that are similar
Outbound Lead Gen vs. Inbound Lead Gen Ratios
Do you have a good inbound lead generation program? What happens if it dries up? You have experienced this during economy shifts. Why having a solid inbound and outbound game is critical. Model out how many leads you get from inbound vs outbound and determine which of your prospect are a sales qualified lead.
Make sure it’s a healthy split and that you have levers to pull if you need to increase outbound at any given time if inbound dries up.
Sales Pipeline by Service Line
Measure the prospects by the service/product you are selling. As you see those trends you can strategically start to understand where you might want to allocate more resources to help service those new clients. This would be another data point where you can start to focus on your flourishing products.
Additionally, you can also compare this data to find out what services you do offer that for some reason isn’t selling. This is where customer engagement metrics and data analytics can be exceptionally helpful. There might be some challenges with the product offering or maybe a skills training you need to do with your sales people.
Efficiency & Profit Margin Leading Indicators
Revenue per Production Employee (Grayson)
This is a very important metric to assure that your revenue is turning into bottom line profit and that your staffing is right for the revenue trends.
For us at Power Digital, a production employee is any team member outside of the executive team, sales people, and admins and we use a real time dashboard to measure this on a companywide level, department level and individual level.
It enables us to see where we need resources and where we need more training with our staff to get them more efficient and profitable. This date provides lots of actionable opportunities for us to optimize our processes and team in real time to grow profit margin and maximize employee profitability.
Profitability by Account
By measuring this you will be able to look more strategically at your resources. If you are underwater on an account what can you do to make it profitable or at least trending in the right direction.
Can we renegotiate with the client? Are we doing more than we are contracted to do? Are there more efficient ways to execute the contract? Are the right resources/people working on the account?
Measuring this gives you the ability to make better decisions.
Client Retention Rate
One of the most important metrics you must be tracking. This data can tell you what combination of services/people/industries needs to be leveled up in your organization. It can pinpoint specific areas of opportunity with personnel and it can also do the same for a service that you are selling. Measuring this data will allow you to take action by adding resources, training, etc.
By looking at this metric and the Net New Client revenue you will be able to assess the health of your business.
OpEx Cost Contribution Percentage
During these times of uncertainty looking at OpEx contribution % and also comparing that % to the business plan is critical. This is an area we have right sized in this “new norm environment” and part of that was conducting a “Wasted Spend Analysis” in which our exec team sat in a conference room and went line by line down the general ledger to determine costs we can cut, renegotiate or pause.
Our digital marketing agency was able to shed a substantial amount of redundant expenses and get our cost structure to be more variable so that the costs would come and go with revenue and not be a fixed cost that remained which was very important given the volatility that currently exists in the market.
Return on Marketing Spend
What is your return on marketing spend? Simple equation.
Total sales driven / by total amount of money spent on marketing.
This includes ad spend and internal or external administration costs (employees or marketing agencies). What is critical here – is this ration.
Example: Let’s say your return on marketing spend is 2:1. Meaning you get $2.00 in sales for every $1 spent. If your profit margin is below 50%, then you are losing money! Keep your eye on total marketing spend as a ratio to total sales. This is a critical metric here to stay healthy.
Free Cash Flow Analysis and Reserves
Cash is so critical to making it through times of uncertainty. Every monday we do a cash analysis to assure that our current cash is aligned with our leading indicators and business plan and so we dont get into a cash crunch that hampers our longevity and staying power.
We analyze this against our AR and AP and use a simple formula to assure we are healthy and don’t get caught in a vulnerable position. It’s part of our weekly cadence and a leading indicator we review every Monday as an Executive Team.
Personnel & Culture Leading Indicators
Employee Sentiment and Moral Across Role, Department & Managers
During this time of chaos and for many companies moving fully remote, this is a very important leading indicator to assure your team is happy, not burning out, and is committed to battle for the mission your company is after. There are going to be tough times when dealing with this environment but it’s important to listen more than ever to our teams and be empathetic to the struggles people are going through. One tool that we have used for many years at Power Digital that makes it easy to have this type of leading indicator dashboard is 15Five.
You can set it up so your team scores things like:
- Bandwidth
- Sentiment
- Biggest Time Wasters
- Where they Expressed your Companies Core Values
And so much more through these weekly surveys that are pretty automated and keep your leadership team aligned with the field and also gives company wide data on trends across these types of areas.
Performance Management
More than ever this is a key metric to the success of your company. The days of “carrying” individuals is not a luxury that companies can afford nowadays in the new norm. Whatever benchmarks for performance your company sets, you have to measure it, report it, and hold people accountable to it. This is how you help grow your people’s skillsets, how you motivate them, how you inspire them. Coach your people up to the benchmark that your company sets, if they are not able to hit the benchmark than that job or the company may not be a good fit.
Training and Employee Development Progress
A vital component of any company now needs to be more laser-focused. You need to review the job descriptions and expectations of all jobs in your company. To be blunt, it goes deeper than the marketing analytics or revenue growth. Does your current training & development program give them what they need to set them up for success? If not, then actions need to be taken to ensure that the program is put together. When your sales people are not meeting their activity and performance metrics do you have training to help them level-up those skill sets? When your managers have challenges with having difficult conversations or managing a remote workforce, do you have training to help them level-up their skills?
Is Training and Development part of your company culture? If not, it needs to be. More challenges, new challenges, are coming at business everyday. If you have the mindset of working through the challenges or problem solving these challenges your odds of success increase significantly. This mindset can be fostered and developed from a great training and development program.
Bench Strength for Each key Role
This leading indicator is always important for rapidly scaling companies. We have a dashboard and goal that every role in our company always has at least two super star recruits on the bench and ready to be hired. It enables your teams to foster long term relationships, be patient as they recruit the ideal talent profile and assure there are strong core values and culture alignment.
But now more than ever as many companies are forced to make very tough decisions to overhead and potentially scale back resources, it’s critical to have that bench in place so that as things start to get back to normal and business picks back up, you have great talent in place to on-board and realize the business opportunities.
Community Involvement
Keeping employees engaged is one of the most important things for culture. Your mission in business is sometimes less important to everyday employees as your mission to help the community. Many employees are motivated by their community and the engagement between the company they work for.
At Power Digital, we started the WAVES programs (Wishing All Variety Entrepreneurs Success) as our way of giving back and responding to the BLM movement. Our engagement in this program with our employees has been spectacular, and their commitment to the organization has grown stronger. Not only are we finding a way to help bolster up our community but we are driving great engagement with our employees.
Final Thoughts on Importance of Leading Indicators & Getting More Granular During Challenging Times
We provide lots of examples above but it’s really not too complicated. It comes down to really thinking through your own company and business and putting these mechanisms in place to be able to really track progress on a granular level such as daily, weekly, and monthly.
We have found that during these times of uncertainty and overwhelming disruption to how we all normally do business, simplifying the business plan and getting more granular with the business plan and KPIs makes what can feel very overwhelming start to feel more clear and manageable. It creates light at the end of the tunnel during a dark time.