Facebook Breakdowns: Taking A Deeper Dive Into Your Conversion Data

Facebook ‘Breakdowns’ are a somewhat underutilized data segmentation tool. Advertisers will often review performance at the ad / ad set level and draw actionable insights based on their creative or audience target, but will ignore some of the more granular data that can be extrapolated from leveraging Breakdowns.
Where To Find Breakdowns
Within Ads Manager, next to your custom columns, you’ll see a drop-down labeled ‘Breakdown’. The 24 available Breakdowns are categorized by ‘Delivery’, ‘Action’, and by ‘Time’. They all provide value in different ways, but there are 2 specific Breakdowns that can make a huge impact on how you assess your conversion results – the ‘Impression Device’ breakdown, and the ‘Conversion Device’ breakdown.


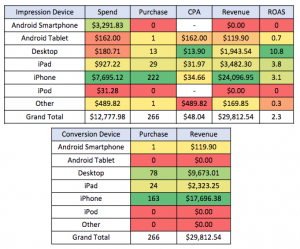
As shown in the images above, the ‘Impression Device’ Breakdown shows the breakdown of devices people were using when they saw your ads. The ‘Conversion Device’ Breakdown shows the device people were using when they took any actions (i.e. make a purchase) as a results of your ads.
Let’s See Some Data…
Below is data for an e-commerce account that could be improved through this dual analysis.

This account is focusing a majority of the spend on mobile, without specifying device type. In the ‘Impression Device’ chart below we can see that Android received roughly a quarter of the spend but hasn’t converted – a clear indicator that the targeting should be limited to iOS users or Desktop to improve account-wide CPA and volume.
Related: How to Get the Most Out of Your Facebook Retargeting
A standout metric across the two charts is the difference in purchase volume shown for Desktop in the ‘Impression Device’ chart compared to the ‘Conversion Device’ chart. There were only 13 conversions driven from ads shown to users on desktop, but 78 total purchases took place on desktop. As a parallel figure, the number of purchases made from an iPhone decreases by 59 – which is a clear indicator that users are seeing ads on their mobile devices, but still preferring to use their desktops to make a purchase than their mobile device.
So, What Is Actionable From This Data?
The first and most obvious action item would be to limit targeting to iOS devices. Android impressions are clearly not moving the needle for the account, while Apple devices are showing strong CPAs and returns. Additionally, these results may indicate that the mobile checkout experience may need some serious adjustments, particularly for Android devices. A poor user flow will always lead to lower conversion rates, so it wouldn’t hurt to make sure that all mobile device types have a smooth & seamless experience.
Related: Understanding Facebook’s Advertising Delivery System
The next would be to invest more on desktop – it had the strongest CPA and the best ROAS. The spend level was low, so it would be paramount to keep a close eye on performance as spending scales up. It may also be effective to lean heavily on desktop for remarketing efforts. From a user behavior standpoint, people still often prefer using their desktop to make purchases over their phones and tablets, and tend to have a higher AOV on desktop. So, prospect using mobile, but lean on desktop for the 2nd & 3rd touchpoints to drive the sale.
Wrapping it All Up
Clearly it’s possible to find some unexpected data-learnings by leveraging FB’s full suite of Breakdowns, so don’t ignore data that could help your digital presence. In this example, we’ve been able to identify some problems and solutions with our FB approach (targeting specific devices, leaning more on Desktop), and our UX (how can we help make our mobile experience better to reduce so many mobile-to-desktop conversions).
We found these from taking advantage of only 2 of the 24 breakdowns FB has to offer. In the upcoming weeks we’ll touch on some additional breakdowns, but in the meantime try these out for yourself and see what you discover!
Our Editorial Standards
Reviewed for Accuracy
Every piece is fact-checked for precision.
Up-to-Date Research
We reflect the latest trends and insights.
Credible References
Backed by trusted industry sources.
Actionable & Insight-Driven
Strategic takeaways for real results.


