Four Executive Level Filters to Get You Started with Google Analytics
Over the years I’ve worked with countless entrepreneurs and executives who rely heavily on digital channels to drive KPI’s and support their company growth. One thing always amazes me is that a high percentage of these successful, data-driven (in other aspects of their biz), leaders have no idea how to dig into their website’s analytics to understand the trends of their site, winning and losing traffic sources, and conversion rates.
After holding a number of trainings with these business leaders I’ve decided to break down the four main filters that I think all entrepreneurs and executives can benefit from. Before we jump into analytics lets make sure you are a member of your company’s analytics profile. All you need for this is be logged into your Google email address and go to Google Analytics. If you see your analytics profile in there you are in business, if you don’t ask your marketing person or Webmaster to add you, it will take them 20 seconds.
Filter #1: Time and Period Filtering
Why it matters: data doesn’t mean a whole lot without something to compare it against. Comparing based on past performance offers context and allows you to track progress or decline. By comparing the data over different periods of time, you can easily spot trends based on traffic, user metrics, conversion rates and more.
By default Google Analytics will show you the past 30 days of data right when you enter the analytics platform. With one click you can filter that data and compare it against the “previous period” or “previous year”. Both these filters are very beneficial and help you quickly assess how things are looking.
The Previous period filter helps you gauge how your business is doing in the past 30 days compared to the previous 30 days. You can also easily compare Q1 and Q2 against each other.
When filtering through your data it’s important to consider external factors like seasonality that can have a major impact on your site. To account for this in your trends analysis you can select Previous year and take a look at year-over-year growth and gain some valuable insights on your business goals. As you go through the next 3 filters I suggest you use both Previous period and Previous year filters to gauge progress and trends of your business as you evaluate different Traffic Sources, Audiences and Conversion Rates.

Filter #2: Acquisition Filter Aka How Visitors are coming to Your Site
Why does this matter: the acquisition filter will give you immediate insight into the various channels bringing you traffic and website visitors. It helps you to gauge what marketing campaigns are working and which are a drain on resources. When looking at the data with period-over-period or year-over-year filters you can see which channels are flourishing and which are hurting.
Some of the most common channels you will see bringing your site traffic include:
- Direct – pat yourself on the back Mr. Entrepreneur, this is all you. Don’t let anyone take credit for this; it is all the work you have done to build your brand and company’s reputation.
- Organic Search – this is your SEO channel but take it with a grain of salt. A big clump of this traffic is likely “branded search terms” which are people searching your company name in the search engine. Make sure your SEO partner or manager is showing you the “non-branded keyword” rankings and data these are the keywords that describe what you do or your product and not just your brand name.
- Paid Search – your PPC campaigns and traffic coming through your paid ad campaigns.
- Display – traffic coming from your display advertising campaigns.
- Referral – these are often your PR efforts and the traffic that is coming from articles that bloggers or media outlets have written about you. You will also often see some junk traffic from some random sources in here. Make sure you reference this traffic with your conversion rates (more to come) because this traffic typically converts at a very low rate.
- Social – pretty straight forward, the traffic from your social media profiles. On any of these channels you can drill down deeper into the category as you see below and get some deeper insights into which channels are worth the majority of your time and effort (i.e. Facebook, Twitter, LinkedIn, Pinterest, etc.).
Filter #3: Audience Tab
This view gives you a variety of insights into who your audience is, where they are geographically located, what type of device they are viewing your website on (desktop, mobile, tablet – and even more specific such as specific phone, etc) and more.
This section gives great insights into your audience breaking down user metrics based on device. Common issues businesses run into here is extremely high bounce rates or low pages per visit on mobile devices. This may indicate that you need to put some effort into improving your mobile experience for users. There are lots to take away from the Audience tab that can help you improve your website.
Filter #4: Conversions
Correctly setting up conversions is absolutely critical to understanding how your site is performing against your business objectives. There are two conversion types under the conversion section:
Goals
Goals should be set up for actions taken on the site such as a user filling out an inquiry form or an email capture. You can configure your goals in a variety of ways but at the end of the day the main objective is to be able to get more insight into what makes your business money. Tracking leads or inquiries obtained through your site is a great way to measure its value and make sure it is helping you reach your business goals in the most efficient manner possible.
If you are in a service industry setting goals is an essential part of measuring success. A great way to make sure you site gets credit for leads that start on your site or an online channel and then call in to speak with a service representative is to use a tracking service such as CallRail.
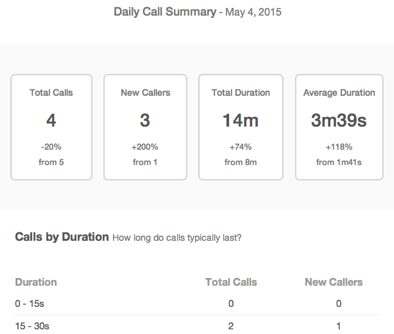
What I like most about CallRail is its simplicity. Easy to implement with a single line of code it allows your business to properly attribute phone call leads or sales to the channel that drove the call such as paid search or organic. Another great feature of CallRail is its reporting platform. You can pull comprehensive spreadsheets in less then a minute that details the caller’s name, call duration, date, time, campaign source and more. You can also set up daily, weekly or monthly (like the one shown below) that allow you to keep your finger on the pulse and put your sales guy in check when he says he doesn’t get enough leads coming through the funnel.
eCommerce
This section of conversions is designed for businesses that sell products online. With eCommerce conversion tracking you can track to the penny how much revenue each channel is bringing your business, what your conversion rates are (percentage of traffic-to-sale), your average order value (AOV) and much more.
Side Note: If you get this image (see below) when you click on goals or eCommerce you should immediately ping your marketing person and figure out why the heck you are not tracking the key actions that make your company money. There is really no excuse for it but we see this missed or configured wrong all the time.
Additional user metrics you should note:
Pages / Session
This is the average number of pages a person visits when they come to your website. It is always interesting to look at this number on a channel-by-channel basis because certain channels such as PPC are going to get the user to the destination they covet faster than others such as direct where they have to navigate to your homepage and than find the page they are looking for.
Avg. Session Duration
This tells you a lot about how engaging your content is. Does your website copy, graphics and engage the user and keep them on your website? This data will help you determine that. It is interesting to look at this stat on a page-by-page basis so you can determine which pages are holding the visitors attention at a higher level than others.
Bounce Rate
A very important user metric to pay attention to, a bounce occurs when a person comes to your website (can be any page) and than immediately leaves without clicking anything else. A high bounce rate (60% and greater) is a really bad thing and is not a positive indicator for you or to Google. There are several fixes and it can be as simple as using the Power Digital Bounce Killer to force the reader to click multiple pages when reading your blog posts, as we did to you here. It can also be a much more serious problem like unqualified traffic coming to your site or slow load times on your pages.
Wrapping It Up
The bottom line here is that we have just scratched the surface on all that Google Analytics can tell you about the state of your business and your sites trends. In general, Google Analytics is pretty intuitive and easy to figure out. As soon as you start playing around with the filters and monitoring your data using these filters you’ll have a much better read on what is working and what’s not.
You can also build out some simple Executive Dashboards so that you can get a variety of different views and data comparisons in one view. This is something we do for almost all our clients at Power Digital and we find that executives tend to prefer this. The data doesn’t lie; get actionable insights on the future of your business online and where to spend your marketing dollars.